Graph
The content of this page is a work in progress.
The original mxGraph tutorial was used to create this page which still contains mxGraph class diagrams to migrate to the maxGraph API.
This tutorial is licensed under Creative Commons Attribution 4.0 International (CC BY 4.0).
It is adapted from the original mxGraph tutorial.
Copyright 2021-present The maxGraph project Contributors
Copyright (c) JGraph Ltd 2006-2017
Instantiate Graph in order to create a graph. This is the central class in the API. Everything else is auxiliary.
To create a new graph instance, a DOM node (typically a DIV) is required:
const node = document.getElementById('id-of-graph-container');
const graph = new Graph(node);
Model
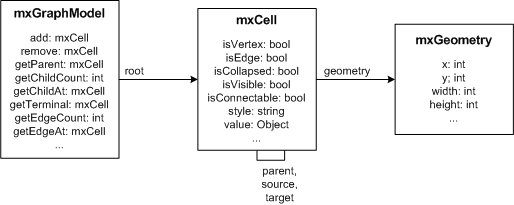
Cell defines the elements of the graph model, which is implemented by GraphDataModel.

The graph model has the following properties:
- The root element of the graph contains the layers. The parent of each layer is the root element.
- A layer may contain elements of the graph model, namely vertices, edges and groups.
- Groups may contain elements of the graph model, recursively.
The graph and structural information is stored in the cells, as well as the user objects, which are used to store the value associated with the cells (aka business objects).
To create a new graph model with a root cell and a default layer (first child):
const root = new Cell();
root.insert(new Cell());
const model = new GraphDataModel(root);
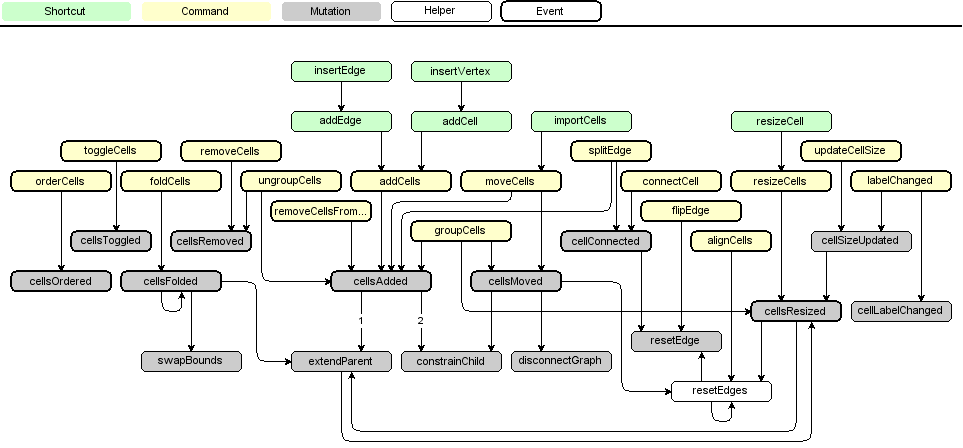
The method call hierarchy is as follows:

Stylesheet
The appearance of the cells in a graph is defined by the stylesheet, which is an instance of Stylesheet. The stylesheet maps from style names to styles.
A style is a CellStateStyle object , to be used with the cells.
To modify the default styles for vertices and edges in an existing graph:
const vertexStyle = graph.getStylesheet().getDefaultVertexStyle();
vertexStyle.rounded = true;

const edgeStyle = graph.getStylesheet().getDefaultEdgeStyle();
edgeStyle.edgeStyle = EdgeStyle.TopToBottom;
Styles
The style information for a cell is stored in cell.style.
The style is part of the cell's state and is normally changed via GraphDataModel.setStyle, which will update all views.
The cell style is a CellStateStyle object which tells the graph to use the given named styles and override the specified keys.
For example, use the Stylesheet.putCellStyle method to set to rounded style
and override the stroke and fill colors, the style would be defined as:
{
  baseStyleNames: ['rounded'],
  strokeColor: 'red',
  fillColor: 'green'
}
To use the above in Hello, World!, the style name would be passed to the insertVertex method as follows:
const v1 = graph.insertVertex(parent, null, 'Hello', 20, 20, 80, 30,
  {
    baseStyleNames: ['rounded'],
    strokeColor: 'red',
    fillColor: 'green'
  }
);
Appearance
In certain cases you may want to override specific attributes based on dynamic properties of a cell (i.e. it's value, aka. UserObject), such as
the image, indicator shape, -image, -color or -gradient color), in which case you can override
getImage, getIndicatorShape, getIndicatorImage, getIndicatorColor and getIndicatorGradientColor respectively.
Note that these methods take a cell state as an argument, which points to a "resolved" version of the cell's style.
Hence, the default implementation for getImagelooks as follows:
graph.getImage = function(state: CellState) {
  if (state?.style) {
    return state.style.image;
  }
  return null;
}
This method may be overridden to return any image for the given state.
Typically, the image is defined by either state.cell, which points to the graph cell associated with the state, or by state.cell.value,
which refers to the cell's user object.
Due to the nature of the display, where all cells are created once and updated only if the model fires a notification for a change,
you must invoke view.invalidate(cell) for each cell whose image has changed, and call view.validate to update the display.