Introduction
This manual is licensed under Creative Commons Attribution 4.0 International (CC BY 4.0).
It is adapted from the original mxGraph manual.
Copyright 2021-present The maxGraph project Contributors
Copyright (c) JGraph Ltd 2006-2020
Product Introduction
maxGraph is a JavaScript component that provides features aimed at applications that display interactive diagrams and graphs.
Note by graphs we mean mathematical graphs, not necessarily charts (although some charts are graphs).
See later section What is a Graph for more details.
Being a developer library, maxGraph is not designed specifically to provide a ready to use application, although many of the examples are close to being usable applications.
maxGraph provides all the commonly required functionality to draw, interact with and associate a context with a diagram.
maxGraph comes with a number of examples that help explain how a basic application is put together and showcases individual features of the library.
Developers integrating the library in their application should read the section "Pre-requisites" below.
Given that maxGraph is a component of your application, you must understand how JavaScript web applications are constructed at an architectural level, and how to program both in JavaScript, and any server-side languages used.
maxGraph mainly comprises one JavaScript file that contains all the maxGraph functionality. This is loaded into an HTML web page in a JavaScript section and executes in an HTML container in the browser.
This is an incredibly simple architecture that only requires a web server capable of serving html pages and a JavaScript enabled web browser.
The key advantages of this technology are:
- That no third-party plug-ins are required. This removes plug-in vendor dependence.
- The technologies involved are open and there are many open implementations, no vendor can remove a product or technology that leaves your application unworkable in practise.
- Standardized technologies, meaning your application is deployable to the maximum number of browser users without need for additional configuration or installation at the client computer. Large corporate environments often dislike allowing individuals to install browser plug-ins and do not like to change the standard build rolled out to all machines.
The key disadvantage of this technology is:
- Rendering speed. As the number of cells visible on the user's screen climbs into the hundreds, redrawing slows on most browsers beyond acceptable levels. In information management theory displaying several hundred cells is generally incorrect, since the user cannot interpret the data. There are a number of mechanisms, collectively known as complexity management used to limit the amount of information to sensible levels, and thus maintaining reactive redraw rates for the user. Complexity management is described in a later section of this user manual.
What Applications can maxGraph be used for?
Example applications for a graph visualization library include:
- process diagrams
- workflow and BPM visualization
- flowcharts
- traffic or water flow
- database and WWW visualization
- networks and telecommunications displays
- mapping applications and GIS
- UML diagrams
- electronic circuits
- VLSI
- CAD
- financial and social networks
- data mining
- biochemistry
- ecological cycles
- entity
- cause-effect relationships
- organisational charts
- ...
maxGraph Technologies
maxGraph uses JavaScript for the client-side functionality on the browser.
The JavaScript code in turn uses the underlying vector graphics language on the active browser to render the displayed diagram, currently SVG for all supported browsers.
As a developer you are not exposed to browser specific features.
As mentioned, the vector graphics language varies by browser, so maxGraph abstracts their features into a common class. Similarly, for event handling and DOMs.
Browsers differ in their implementation of these two major browser functionalities, maxGraph exposes a constant API over all browsers and adapts to the inconsistencies behind the scenes.
Licensing
maxGraph is licensed under the Apache 2.0 license. For detailed licensing questions you are always advised to consult a legal professional.
What is a Graph?
Graph visualization is based on the mathematical theory of networks, graph theory. If you're seeking JavaScript bar charts, pie charts, Gantt charts, have a look at the Google Charts instead, or similar.
A graph consists of vertices, also called nodes, and of edges (the connecting lines between the nodes). Exactly how a graph appears visually is not defined in graph theory. The term Cell will be used throughout this manual to describe an element of a graph, either edges, vertices or groups.

A simple Graph
Graph Visualization
Visualization is the process of creating a useful visual representation of a graph. The scope of visualization functionality is one of maxGraphs' main strength.
maxGraph supports a wide range of features to enable the display of cells to only be limited by the skill of the developer and the platform functionality available.
Vertices may be shapes, images, vector drawing, animations, virtually any graphical operations available in browsers.
You can also use HTML mark-up in both vertices and edges.
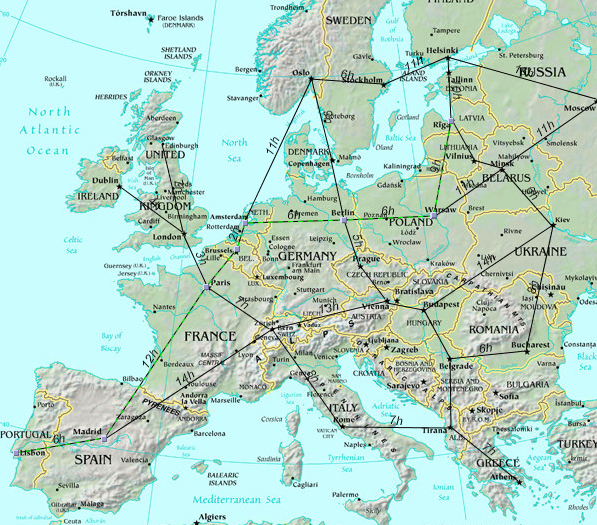
Graph Visualization of a transport system. (c) Tourizm Maps 2003, http://www.world-maps.co.uk
Graph Interaction
Interaction is the way in which an application using maxGraph can alter the graph model through the web application GUI.
maxGraph supports dragging and cloning cells, re-sizing and re-shaping, connecting and disconnecting, dragging and dropping from external sources, editing cell labels in-place and more.
One of the key benefits of maxGraph is the flexibility of how interaction can be programmed.
Many complex graphical web applications rely on a round-trip to the server in order to form the display, not only the base display but also the interaction events.
Although this is often given the title of AJAX functionality, such server reliance is not appropriate for interaction events.
Visual feedback taking longer than about 0.2 seconds in an application generally seriously impacts the usability.
By placing all the interaction on the client, maxGraph provides the true feel of an application, rather than seeming like a dumb remote terminal.
It also allows the possibility of off-line use.
Selection shading while selecting an area through mouse drag
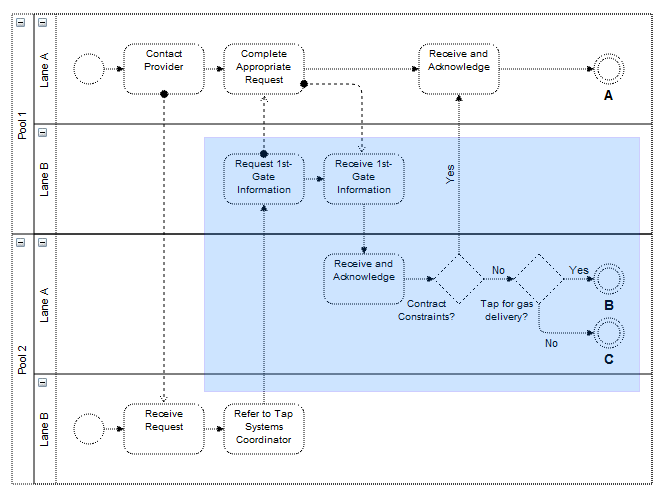
Graph Layouts
Graph cells can be drawn anywhere in a simple application, including on top of one another. Certain applications need to present their information in a generally ordered, or specifically ordered structure. This might involve ensuring cells do not overlap and stay at least a certain distance from one another, or that cells appear in specific positions relative to other cells, usually the cells they are connected to by edges. This activity, called the layout application, can be used in a number of ways to assist users in setting out their graph. For non-editable graphs, layout application is the process of applying a layout algorithm to the cells. For interactive graphs, meaning those that can be edited through the UI, layout application might involve only allowing users to make changes to certain cells in certain positions, to re-apply the layout algorithm after each change to the graph, or to apply the layout when editing is complete.
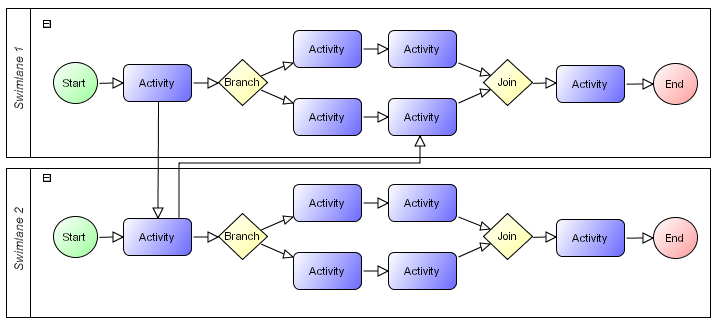
Layout of a workflow using a horizontal hierarchical layout
maxGraph supports a range of tree, force-directed and hierarchical layouts which will fit most layout needs.
See the later section on using the layouts for more information.
Graph Analysis
Analysis of graphs involves the application of algorithms determining certain details about the graph structure, for example, determining all routes or the shortest path between two cells.
There are more complex graph analysis algorithms, these being often applied in domain specific tasks.
Techniques such as clustering, decomposition, and optimization tend to be targeted at certain fields of science and have not been implemented in the core maxGraph packages at the current time of writing.
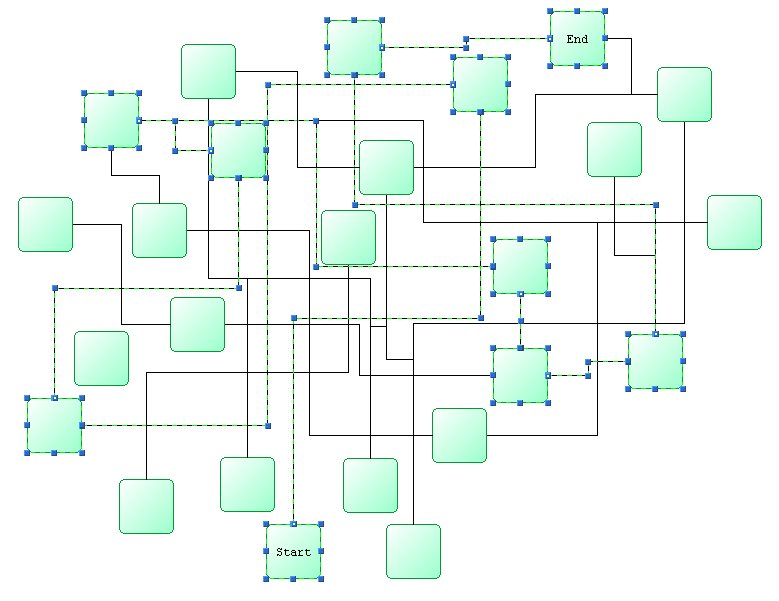
Shortest Path Analysis
About this Manual
Pre-requisites for maxGraph
To benefit fully from this manual you will need to have a reasonable understanding of web applications and of the server technology you wish to deploy using. Deployment examples are available for each of the server technologies supported, some familiarity with that server technology is obviously required.
Basic XML knowledge is useful for changing the editor configuration files that describe the visual and behavioural aspects of the editor. You will need to understand and implement Javascript coding and be familiar with object orientated programming principles and modern software design.
You do not need knowledge of the underlying vector graphics language that the browser uses, such as SVG or HTML canvas.
maxGraph abstracts the description of the visual component into one API.