Getting Started
maxGraph is licensed under the Apache 2.0 license, and its sources are available in the maxGraph GitHub repository.
Released versions are following semantic versioning.
The content of each release is documented in the maxGraph releases GitHub page.
Installation
Install the latest version of maxGraph from the npm registry.
- npm
- pnpm
- yarn
npm install @maxgraph/core
pnpm add @maxgraph/core
yarn add @maxgraph/core
maxGraph is written in TypeScript and provides type definitions for seamless integration into TypeScript applications.
Compatibility of the npm package:
- The JavaScript code conforms to the
ES2020standard and is available in both CommonJS and ES Module formats - TypeScript integration requires TypeScript 3.8 or higher
Basic Usage
Setting up your first graph
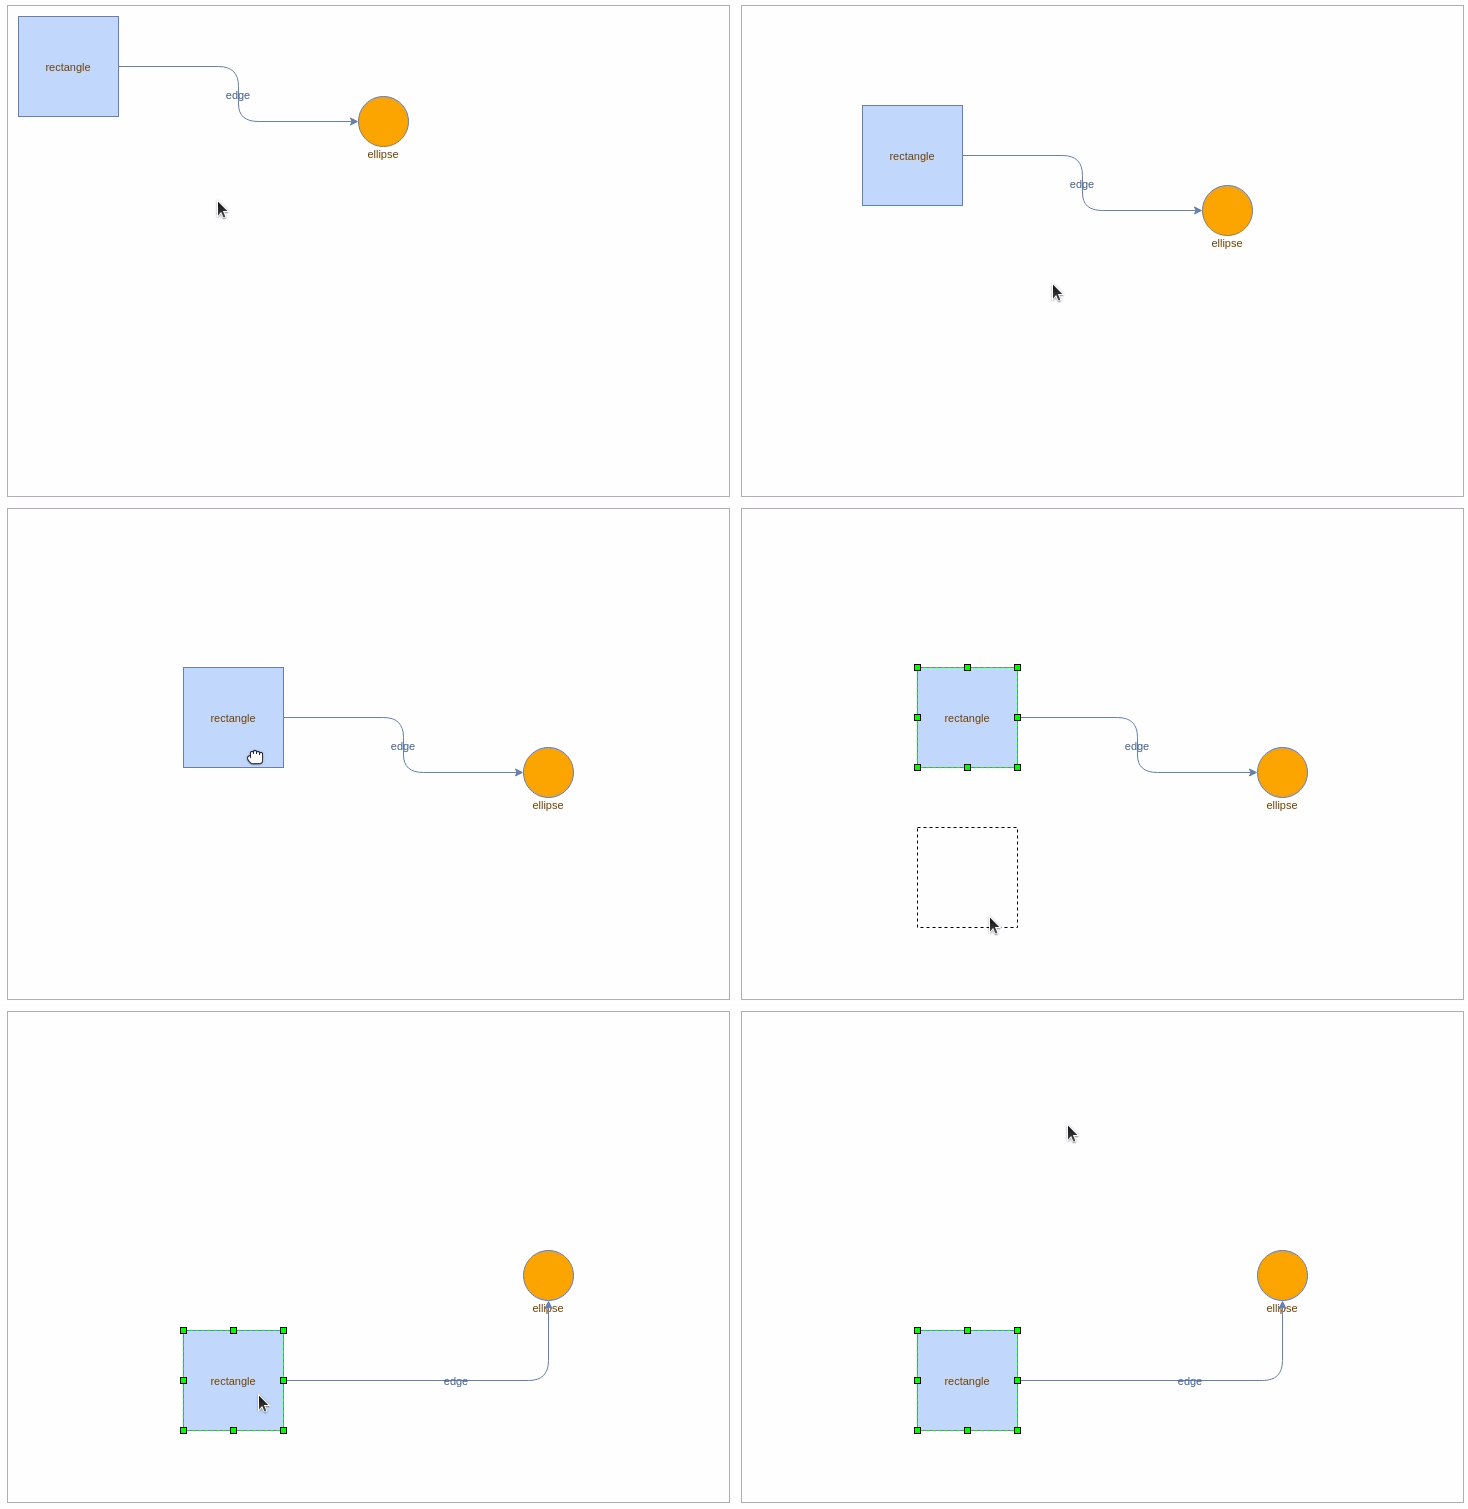
Here is an example that shows how to display a rectangle connected to an orange circle.
This example assumes that:
- you are building an application that includes the
maxGraphdependency, and it has been installed as explained above. - your application uses a build tool or a bundler for its packaging. Direct usage of
maxGraphin a web page is not supported. - your application includes a page that defines an element with the id graph-container.
- you're using
TypeScript. ForJavaScript, simply remove references to the 'type' syntax.
import {type CellStyle, Graph, InternalEvent} from '@maxgraph/core';
// Make sure you have element with id 'graph-container' in your HTML
const container = <HTMLElement>document.getElementById('graph-container');
// Disables the built-in context menu
InternalEvent.disableContextMenu(container);

const graph = new Graph(container);
graph.setPanning(true); // Use mouse right button for panning

// Adds cells to the model in a single step
graph.batchUpdate(() => {
  const vertex01 = graph.insertVertex({
    position: [10, 10],
    size: [100, 100],
    value: 'rectangle',
  });
  const vertex02 = graph.insertVertex({
    position: [350, 90],
    size: [50, 50],
    style: {
      fillColor: 'orange',
      shape: 'ellipse',
      verticalAlign: 'top',
      verticalLabelPosition: 'bottom',
    },
    value: 'ellipse',
  });
  graph.insertEdge({
    source: vertex01,
    target: vertex02,
    value: 'edge',
    style: {
      edgeStyle: 'orthogonalEdgeStyle',
      rounded: true,
    },
  });
});
If you paste this code into your application, you should have minimal graph displayed with a rectangle connected to an orange circle.

Key Concepts
Graph Model
The graph model represents the structure of your graph. It is the foundation of maxGraph and manages three primary elements: vertices, edges, and groups.
Vertices
Vertices are the fundamental elements of your graph that represent individual nodes or objects. They can contain labels, data, and visual properties.
Each vertex can be styled independently with different shapes, colors, sizes, and other visual attributes.
Vertices serve as connection points for edges and can be either standalone or part of a group. They are typically used to represent entities in your diagram, such as process steps in a flowchart, nodes in a network diagram, or components in an architectural diagram.
Edges
Edges are the connections in your graph that typically represent relationships or flows. While edges commonly connect two vertices (a source and a target),
they can also exist as "dangling" edges - edges that are connected to only one vertex or even no vertices at all.
This flexibility allows for various use cases such as partially completed diagrams, interactive drawing scenarios, or representing incomplete connections.
Edges can be styled with different line styles, colors, and thicknesses, and can optionally include labels or weights. They can be directed (showing flow in one direction) or undirected. Common uses include showing data flow in process diagrams, dependencies in architectural diagrams, or relationships in organization charts.
Groups
Groups in maxGraph allow you to logically organize and structure your graph elements.
A group is essentially a parent cell (typically a vertex) that can contain other cells (vertices and edges) as its children, creating what's sometimes called a sub-graph.
Think of groups like folders in a file system - they help organize and manage related elements together.
Groups enable several powerful features in maxGraph:
- Hierarchical organization of your graph elements
- Ability to collapse/expand sections of your graph
- Collective operations on multiple related elements
- Creation of complex nested structures
- Visual separation of different logical components
For example, you might use groups to:
- Create swimlanes in a business process diagram
- Organize related components in a system architecture
- Bundle connected nodes in a network diagram
- Structure departments in an organization chart
Basic Operations
- Adding Vertices:
const vertex01 = graph.insertVertex({
    position: [10, 10], // 0,0 is the top-left corner. So this is 10 pixels from the top and 10 pixels from the left.
    size: [100, 100], // width and height of your vertex
    value: 'rectangle', // The text to display in the vertex
});
- Adding Edges:
  graph.insertEdge({
    source: vertex01, // Source vertex
    target: vertex02, // Second vertex that edge should point to
    style: {
      edgeStyle: 'orthogonalEdgeStyle',
      rounded: true,
    },
  });
- Handling Events:
// This code adds two listeners, one for click and one when some cell is moved
graph.addListener(InternalEvent.CLICK, (sender, evt) => {
  const cell = evt.getProperty('cell');
  if (cell) {
    // Handle cell click
    console.log('Clicked cell:', cell);
  }
});
graph.addListener(InternalEvent.CELLS_MOVED, (sender, evt) => {
    const cells = evt.getProperty('cells');
    console.log(`Number of cells moved is: ${cells.length}`);
})
Styling
maxGraph supports styling both vertices and edges. Here is an example of how to apply a default style to vertex.
To extend the example from setting up your first graph, let's add some styling to the vertices.
// Put this code when initializing graph, before any insertVertex call has been made.
const vertexStyle = graph.getStylesheet().getDefaultVertexStyle();
vertexStyle.rounded = true;
vertexStyle.dashed = true;
vertexStyle.strokeWidth = 2;
vertexStyle.strokeColor = 'green';
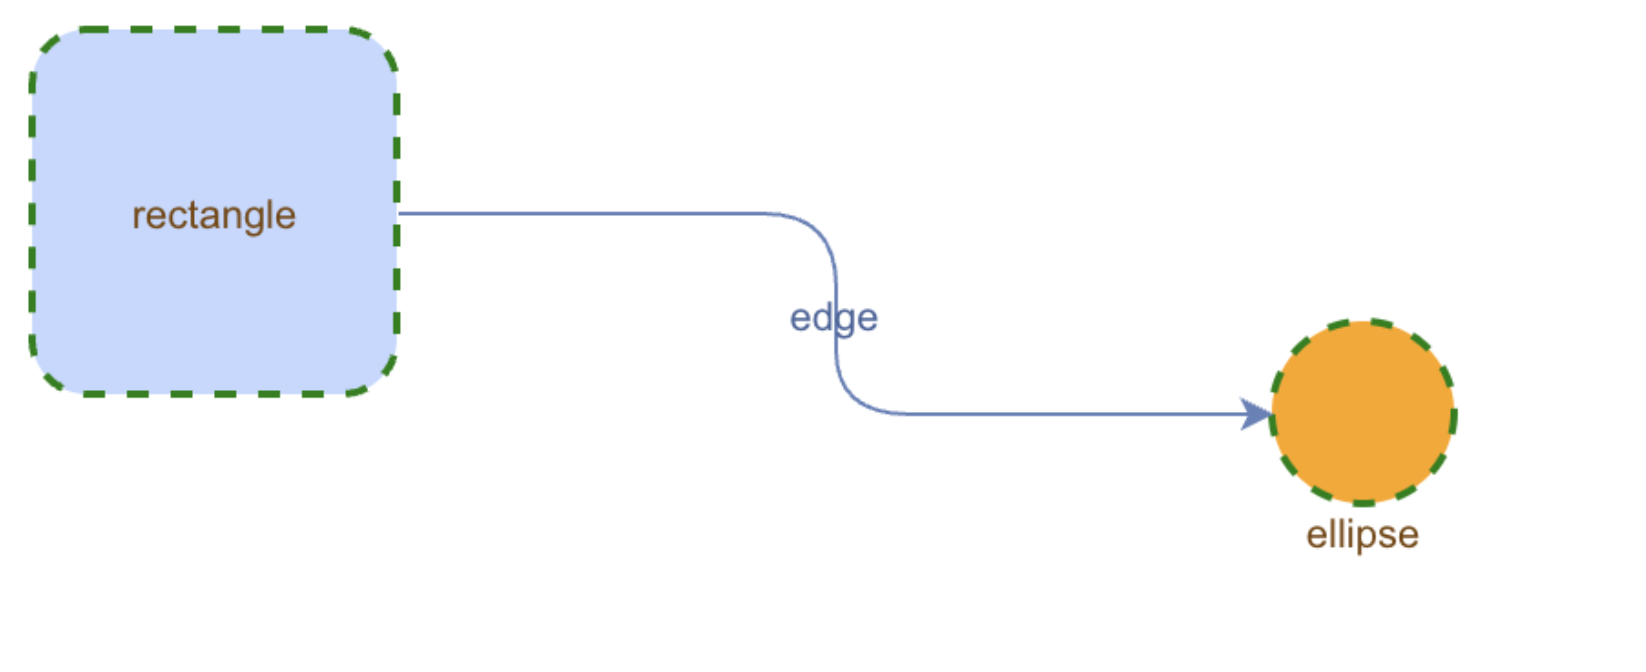
Your vertices will now have a dashed green border with a width of 2 pixels.

Need Help?
- For usage question, please open a new discussion on GitHub. You can also use
GitHub discussions for other topics like
maxGraphdevelopment or to get the latest news. - For bug reports, feature requests, or other issues, please open a new issue on GitHub.